|

|
Comparison of the Composition of Bloomery
Iron
from the Viking Age and from the Modern Era
|
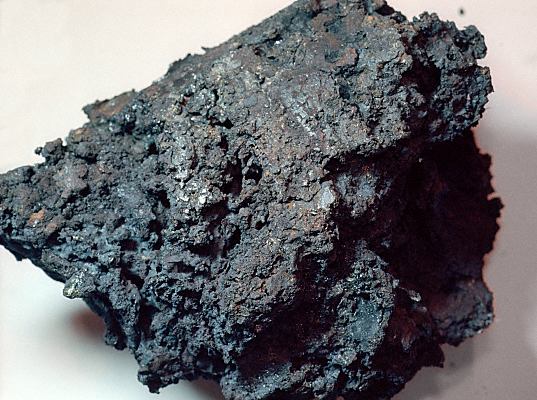
Hurstwic recently smelted iron using a Viking-age bloomery furnace. The smelt was successful, resulting in a 11+ kg (25lbs) bloom (right) containing what appears to be good quality iron. More recently, we did another smelt, resulting in a high-quality steely bloom, with many fewer slag inclusions and voids. A slide show of the more recent smelt is here. More information about Viking-age iron smelting is here. I was curious to compare the compositions of our iron blooms to that of a bloom created in the Viking age. |
 |
 |
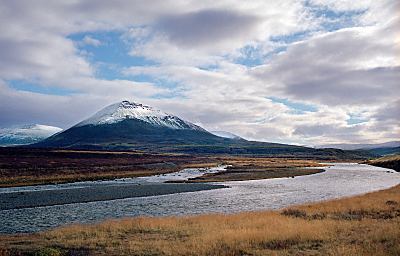
For comparison, I used measurements of bloomery iron excavated at a Viking-age iron-making complex at Skógar in Fnjóskadalur in north Iceland, a short distance above the river shown in the photo. The site was excavated in 2011 and 2012 (Guđmundur St. Sigurđarson and Guđný Zoëga, 2013), and the analysis of the bloom and related finds was done shortly after (O. Nordland, 2015) |
|
The bloom fragment found at Skógar is labeled S#101 and is an irregular shape about 10x8x2cm. Our first sample, labeled H001, was cut from the bloom and is about 2x2x1cm. Our second sample, H002, was cut from the bloom from the second smelt, and is about 2x2x2cm |
|
|
|
|
|
All the specimens are highly magnetic, and the sheen of metallic iron can be easily seen in all three samples after cutting. |
|
In both cases, a section was cut, mounted, and polished for analysis. The samples show iron with inclusions of other material, typically slag. Our H001 sample (right) was highly porous, with numerous voids. The H002 sample had fewer voids and inclusions. |
|
|
|
 |
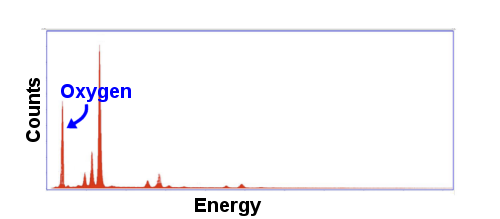
SEM-EDS was used to analyze the iron portions and the slag portions of each sample separately. The process illuminates a small spot of the sample with electrons and measures the spectrum of the X-rays emitted (left). Characteristic energy levels corresponding to various elements can be identified in the spectra, identifying the elements present. The quantity of each energy level identifies the amount of the element present. From this information, the composition of the spot being illuminated can be estimated. The spectrum shown to the left is for the measurement of one of the slag instrusions in H001. The large peak at the left corresponds to oxygen. The height of the peak allows us to calculate the relative amount of oxygen compared to other elements. One limitation of SEM-EDS is that it cannot detect elements lighter than boron. Additionally, light elements are less well estimated. A rule of thumb is that carbon needs to be present at levels above 1% to be reliably detected and measured. |
The measured composition of the iron portion of the two blooms is shown in the table. For each element detected, the weight is shown (in percentage of total weight).
|
S#101 |
H001 |
H002 |
||||
|
Fe |
100% |
100% |
100% |
|||
The measured composition of the slag portion of the two blooms is shown in the table. For each element detected, the weight is shown (in percentage of total weight). An asterisk indicates that if the element was present, it was below detectable levels.
|
S#101 |
H001 |
H002 |
||||
|
O |
48.3% |
42.2% |
47.5% |
|||
|
Na |
0.1% |
* |
* |
|||
|
Mg |
0.7% |
3.4% |
* |
|||
|
Al |
0.7% |
8.1% |
* |
|||
|
Si |
5.9% |
31.6% |
50.3% |
|||
|
P |
0.2% |
* |
* |
|||
|
S |
0.3% |
* |
* |
|||
|
K |
0.2% |
2.5% |
* |
|||
|
Ca |
1.3% |
6.5% |
* |
|||
|
Ti |
0.1% |
0.5% |
* |
|||
|
Mn |
0.5% |
1.5% |
* |
|||
|
Fe |
41.4% |
3.8% |
2.2% |
|||
I was surprised by the purity of the iron in each case. I expected to see more impurities, at least at trace levels.
I was not surprised to see large differences in the composition of the slag inclusions. For one thing, we did not use natural ore for our smelt, but rather an ore analog that had fewer impurities than natural ore.
S#101 had a high level of iron in the slag inclusions, something noted by Nordland. H001 and H002 had surprisingly low levels of iron in the slag, generally thought to be indicative of poor quality iron in the bloom. Yet the iron in H001 seems to be of good quality, and the H002 even higher quality. H001 and H002 are also notable for having higher than expected levels of silicon in the slag.
 |
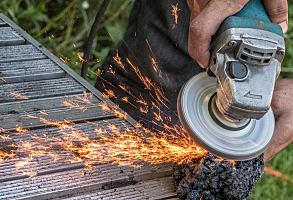
A spark test of the H002 bloom (left) suggested a carbon content in the 0.6% range or so. The SEM-EDS test is incapable of detecting a carbon level that small. So, we used a combustion test to measure carbon level, which gave a result of 0.14% carbon. This test is a bulk test, using a sample about 1x1x1mm, so it is possible that the sample included slag inclusions as well as iron. Regardless, this is a lot less carbon than expected. One possible explanation is that perhaps the carbon content varied throughout the bloom, and the portion of the bloom used for the spark test had a different carbon level that the portion used for the combustion test. |
|
An examination of the surfaces of the two samples in visible light after etching with nital reveals the microstructure of the iron. The green bar indicates 1mm. The H001 sample shows many different structures, suggesting many different regimes of iron formation. |
|
|
In no way is our comparison the final word. As our iron smelting project moves forward, we expect to create more blooms which we plan to analyze using these and other analytical tools. We are eager to fine-tune our analyses and compare them to the Skógar finds and to other Viking-age bloom samples. Additionally, we have been trying other furnace designs, include a turf-built furnace which probably closely resembles those used in Viking-age Iceland, based on some new (and still on-going) archaeological research. A slide show of those experiments is here.
|
|
|
|
|
|
|
©2018-2026 William R. Short |